Built-in Dashboards
Grafana UI
Grafana allows you to query, visualize, alert on and understand your metrics no matter where they are stored. Create, explore, and share dashboards with your team and foster a data driven culture.
To see the default dashboards for time series data visualization, go to the Grafana UI.
Customizing Grafana
To view and customize the PromQL queries powering the Grafana dashboard, see this page.
Persistent Grafana Dashboards
To create a persistent Grafana dashboard, see this page.
Access to Grafana
For information about role-based access control for Grafana, see this section.
Alertmanager UI
When rancher-monitoring is installed, the Prometheus Alertmanager UI is deployed, allowing you to view your alerts and the current Alertmanager configuration.
This section assumes familiarity with how monitoring components work together. For more information about Alertmanager, see How Alertmanager Works.
Accessing the Alertmanager UI
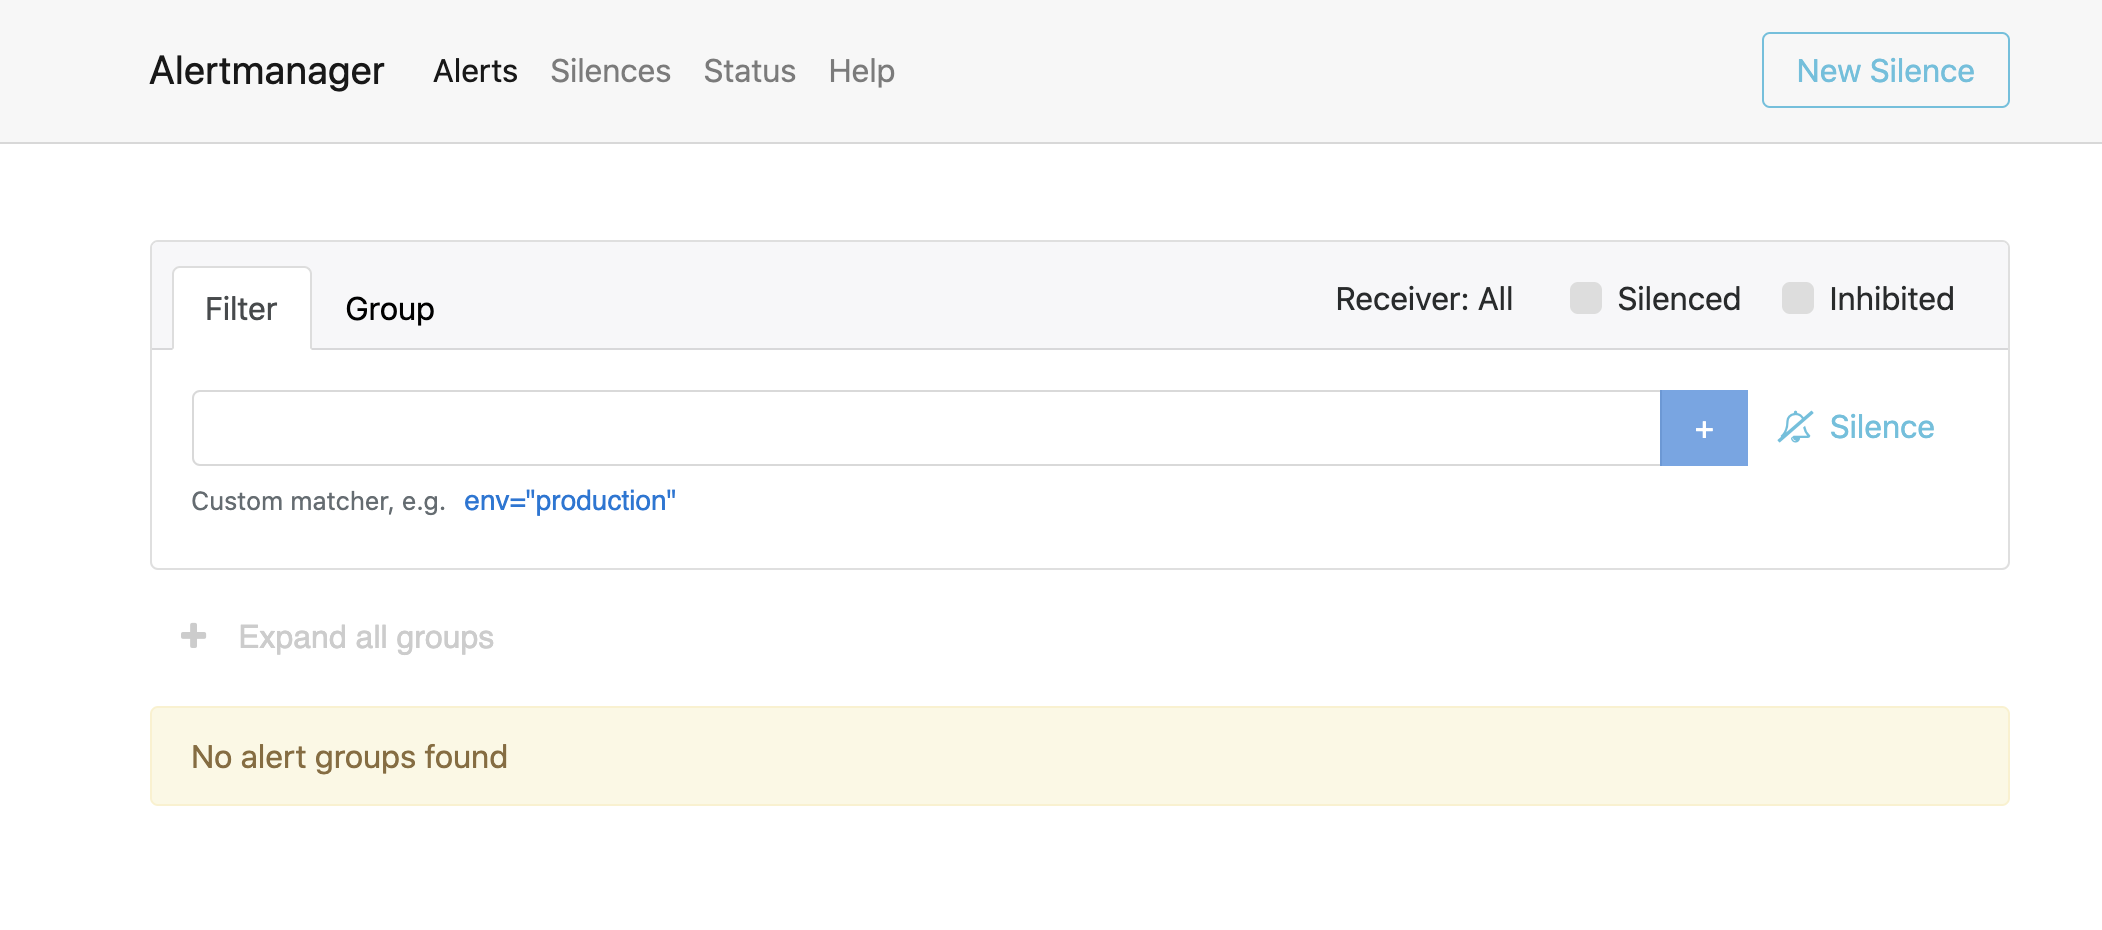
The Alertmanager UI lets you see the most recently fired alerts.
The rancher-monitoring application must be installed.
To see the Alertmanager UI,
- In the upper left corner, click ☰ > Cluster Management.
- On the Clusters page, go to the cluster where you want to see the Alertmanager UI, click Explore.
- In the left navigation bar, click Monitoring.
- Click Alertmanager.
Result: The Alertmanager UI opens in a new tab. For help with configuration, refer to the official Alertmanager documentation.
For more information on configuring Alertmanager in Rancher, see this page.

Viewing Default Alerts
To see alerts that are fired by default, go to the Alertmanager UI and click Expand all groups.
Prometheus UI
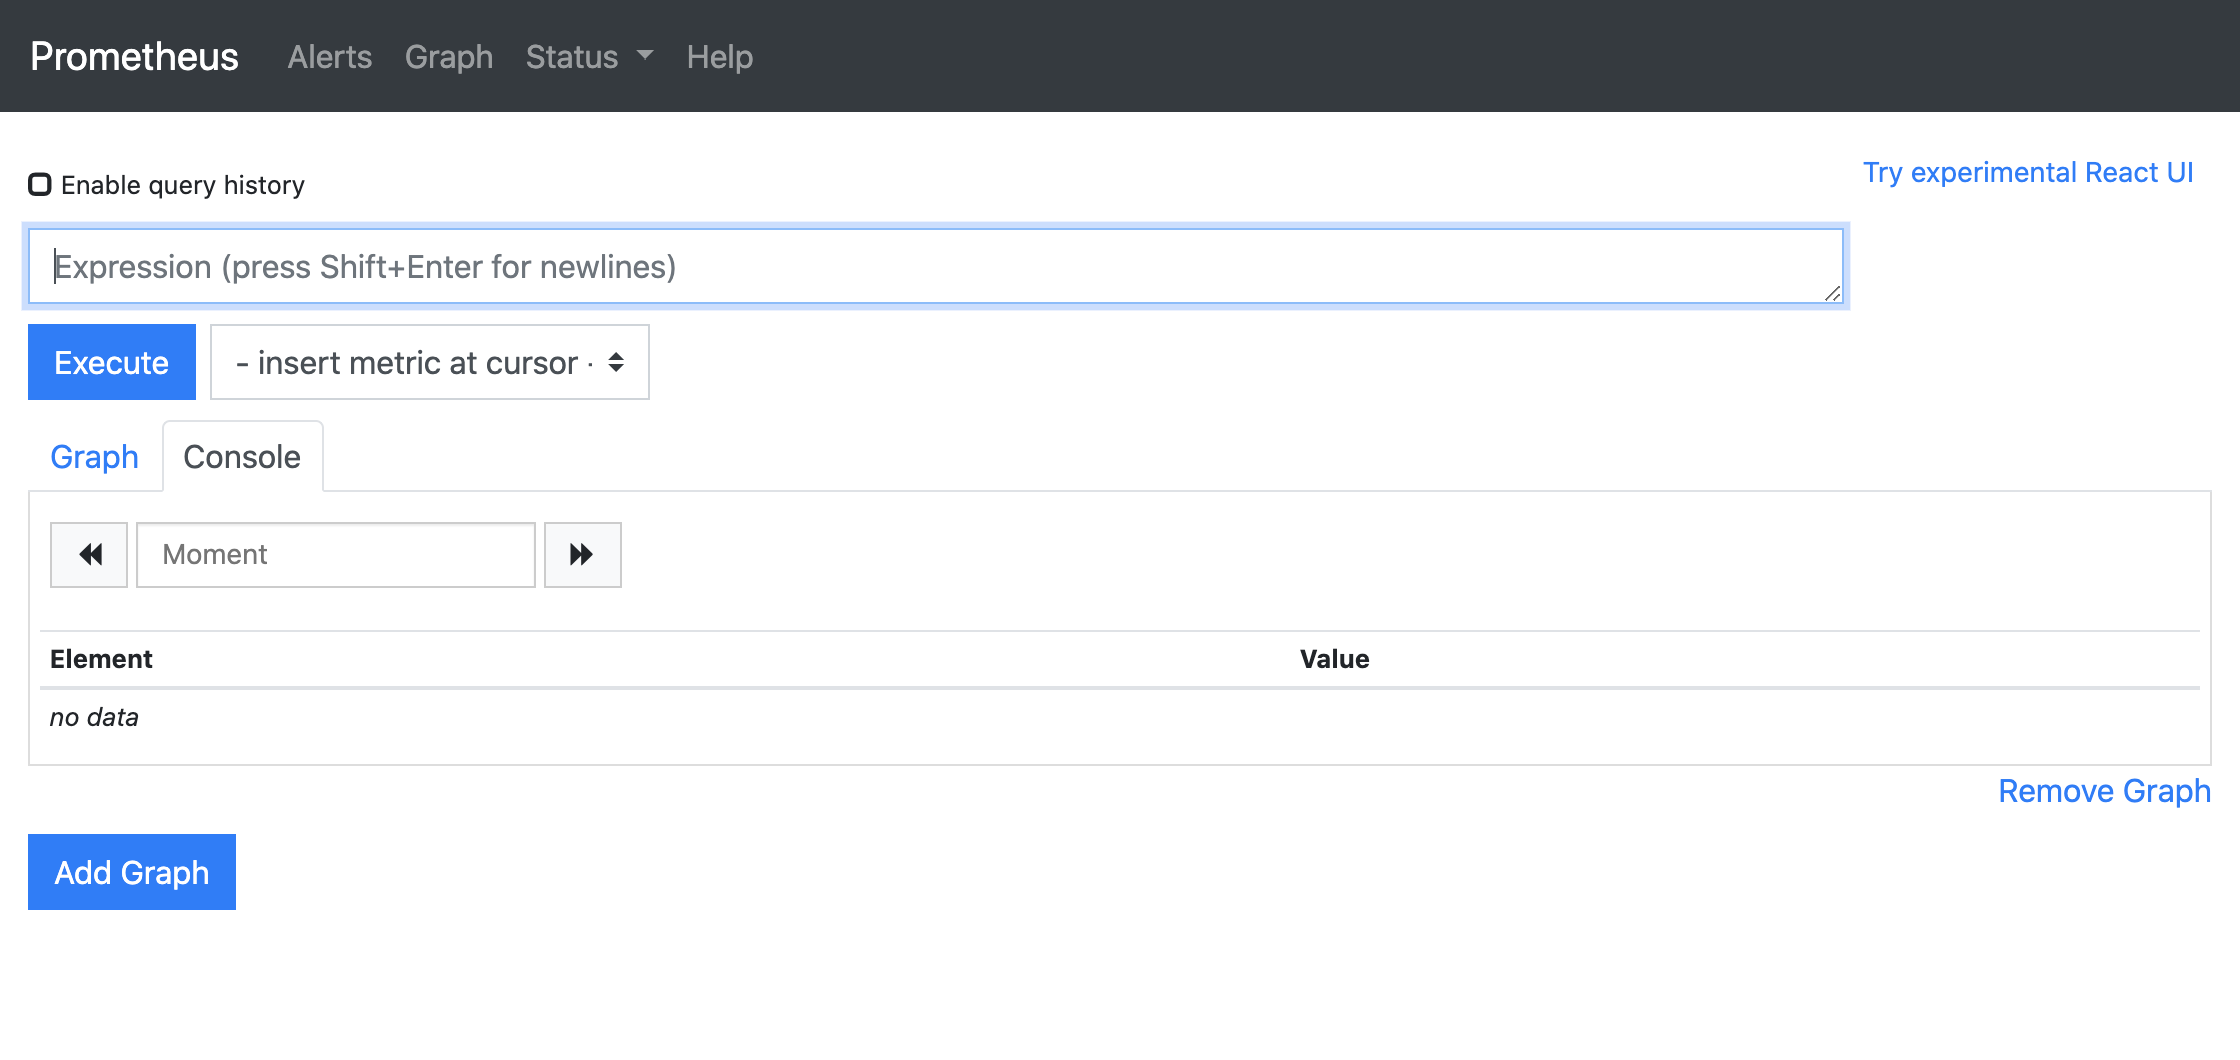
By default, the kube-state-metrics service provides a wealth of information about CPU and memory utilization to the monitoring application. These metrics cover Kubernetes resources across namespaces. This means that in order to see resource metrics for a service, you don't need to create a new ServiceMonitor for it. Because the data is already in the time series database, you can go to the Prometheus UI and run a PromQL query to get the information. The same query can be used to configure a Grafana dashboard to show a graph of those metrics over time.
To see the Prometheus UI, install rancher-monitoring. Then:
- In the upper left corner, click ☰ > Cluster Management.
- On the Clusters page, go to the cluster where you want to see the Prometheus UI and click Explore.
- In the left navigation bar, click Monitoring.
- Click Prometheus Graph.

Viewing the Prometheus Targets
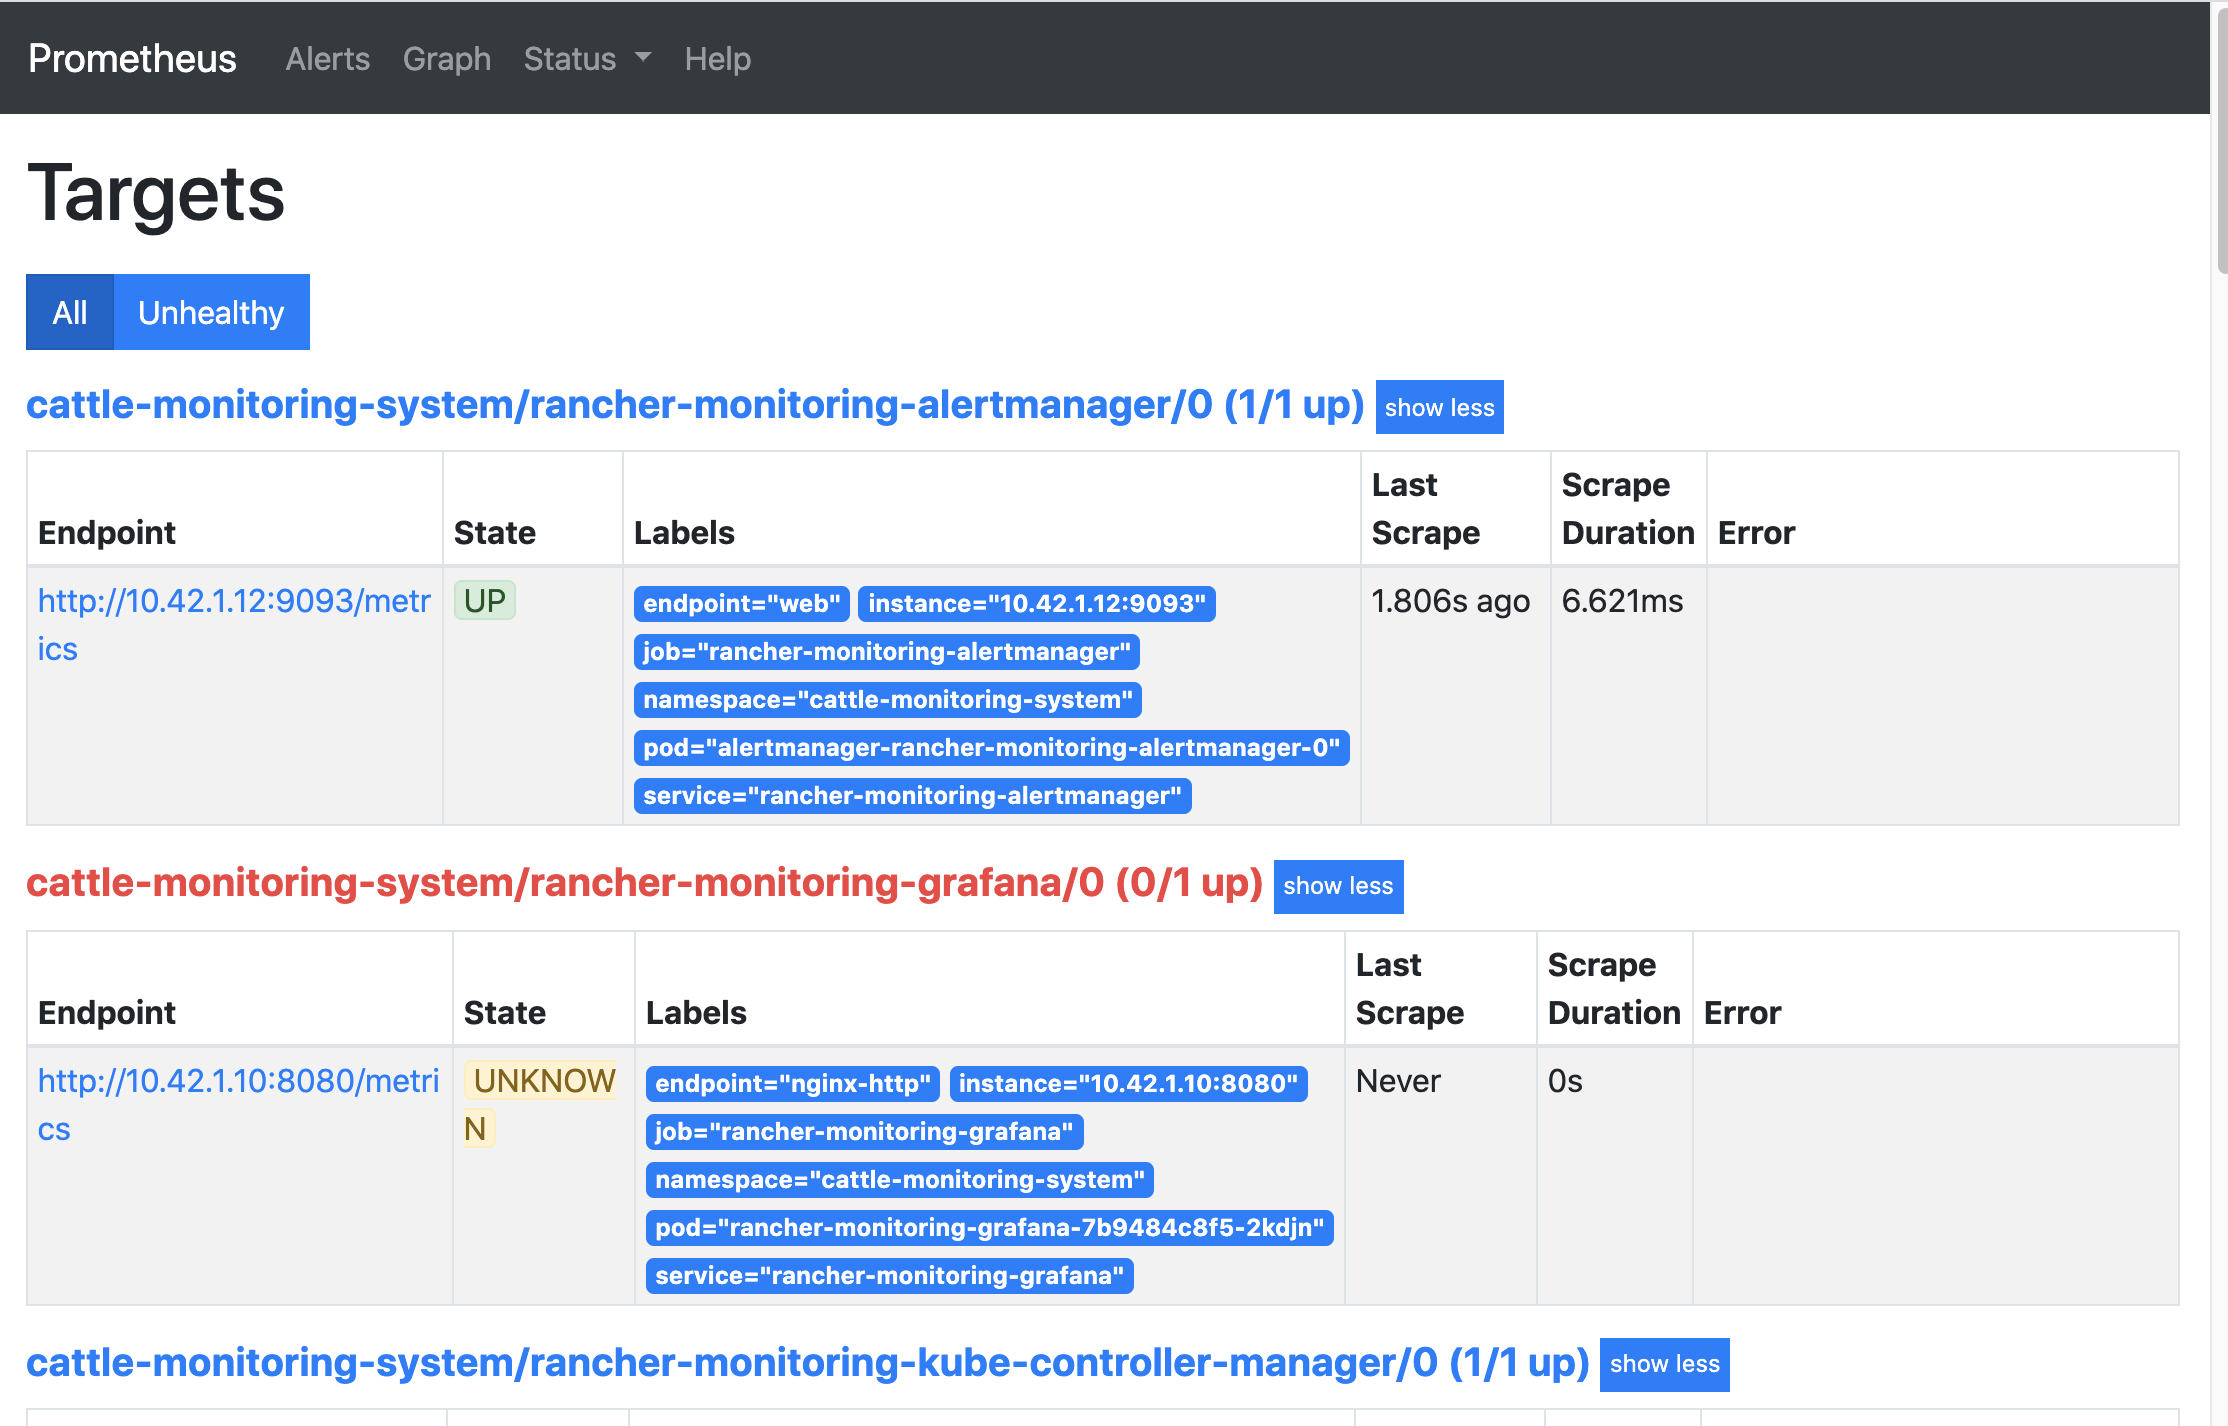
To see what services you are monitoring, you will need to see your targets. Targets are set up by ServiceMonitors and PodMonitors as sources to scrape metrics from. You won't need to directly edit targets, but the Prometheus UI can be useful for giving you an overview of all of the sources of metrics that are being scraped.
To see the Prometheus Targets, install rancher-monitoring. Then:
- In the upper left corner, click ☰ > Cluster Management.
- On the Clusters page, go to the cluster where you want to see the Prometheus targets and click Explore.
- In the left navigation bar, click Monitoring.
- Click Prometheus Targets.

Viewing the PrometheusRules
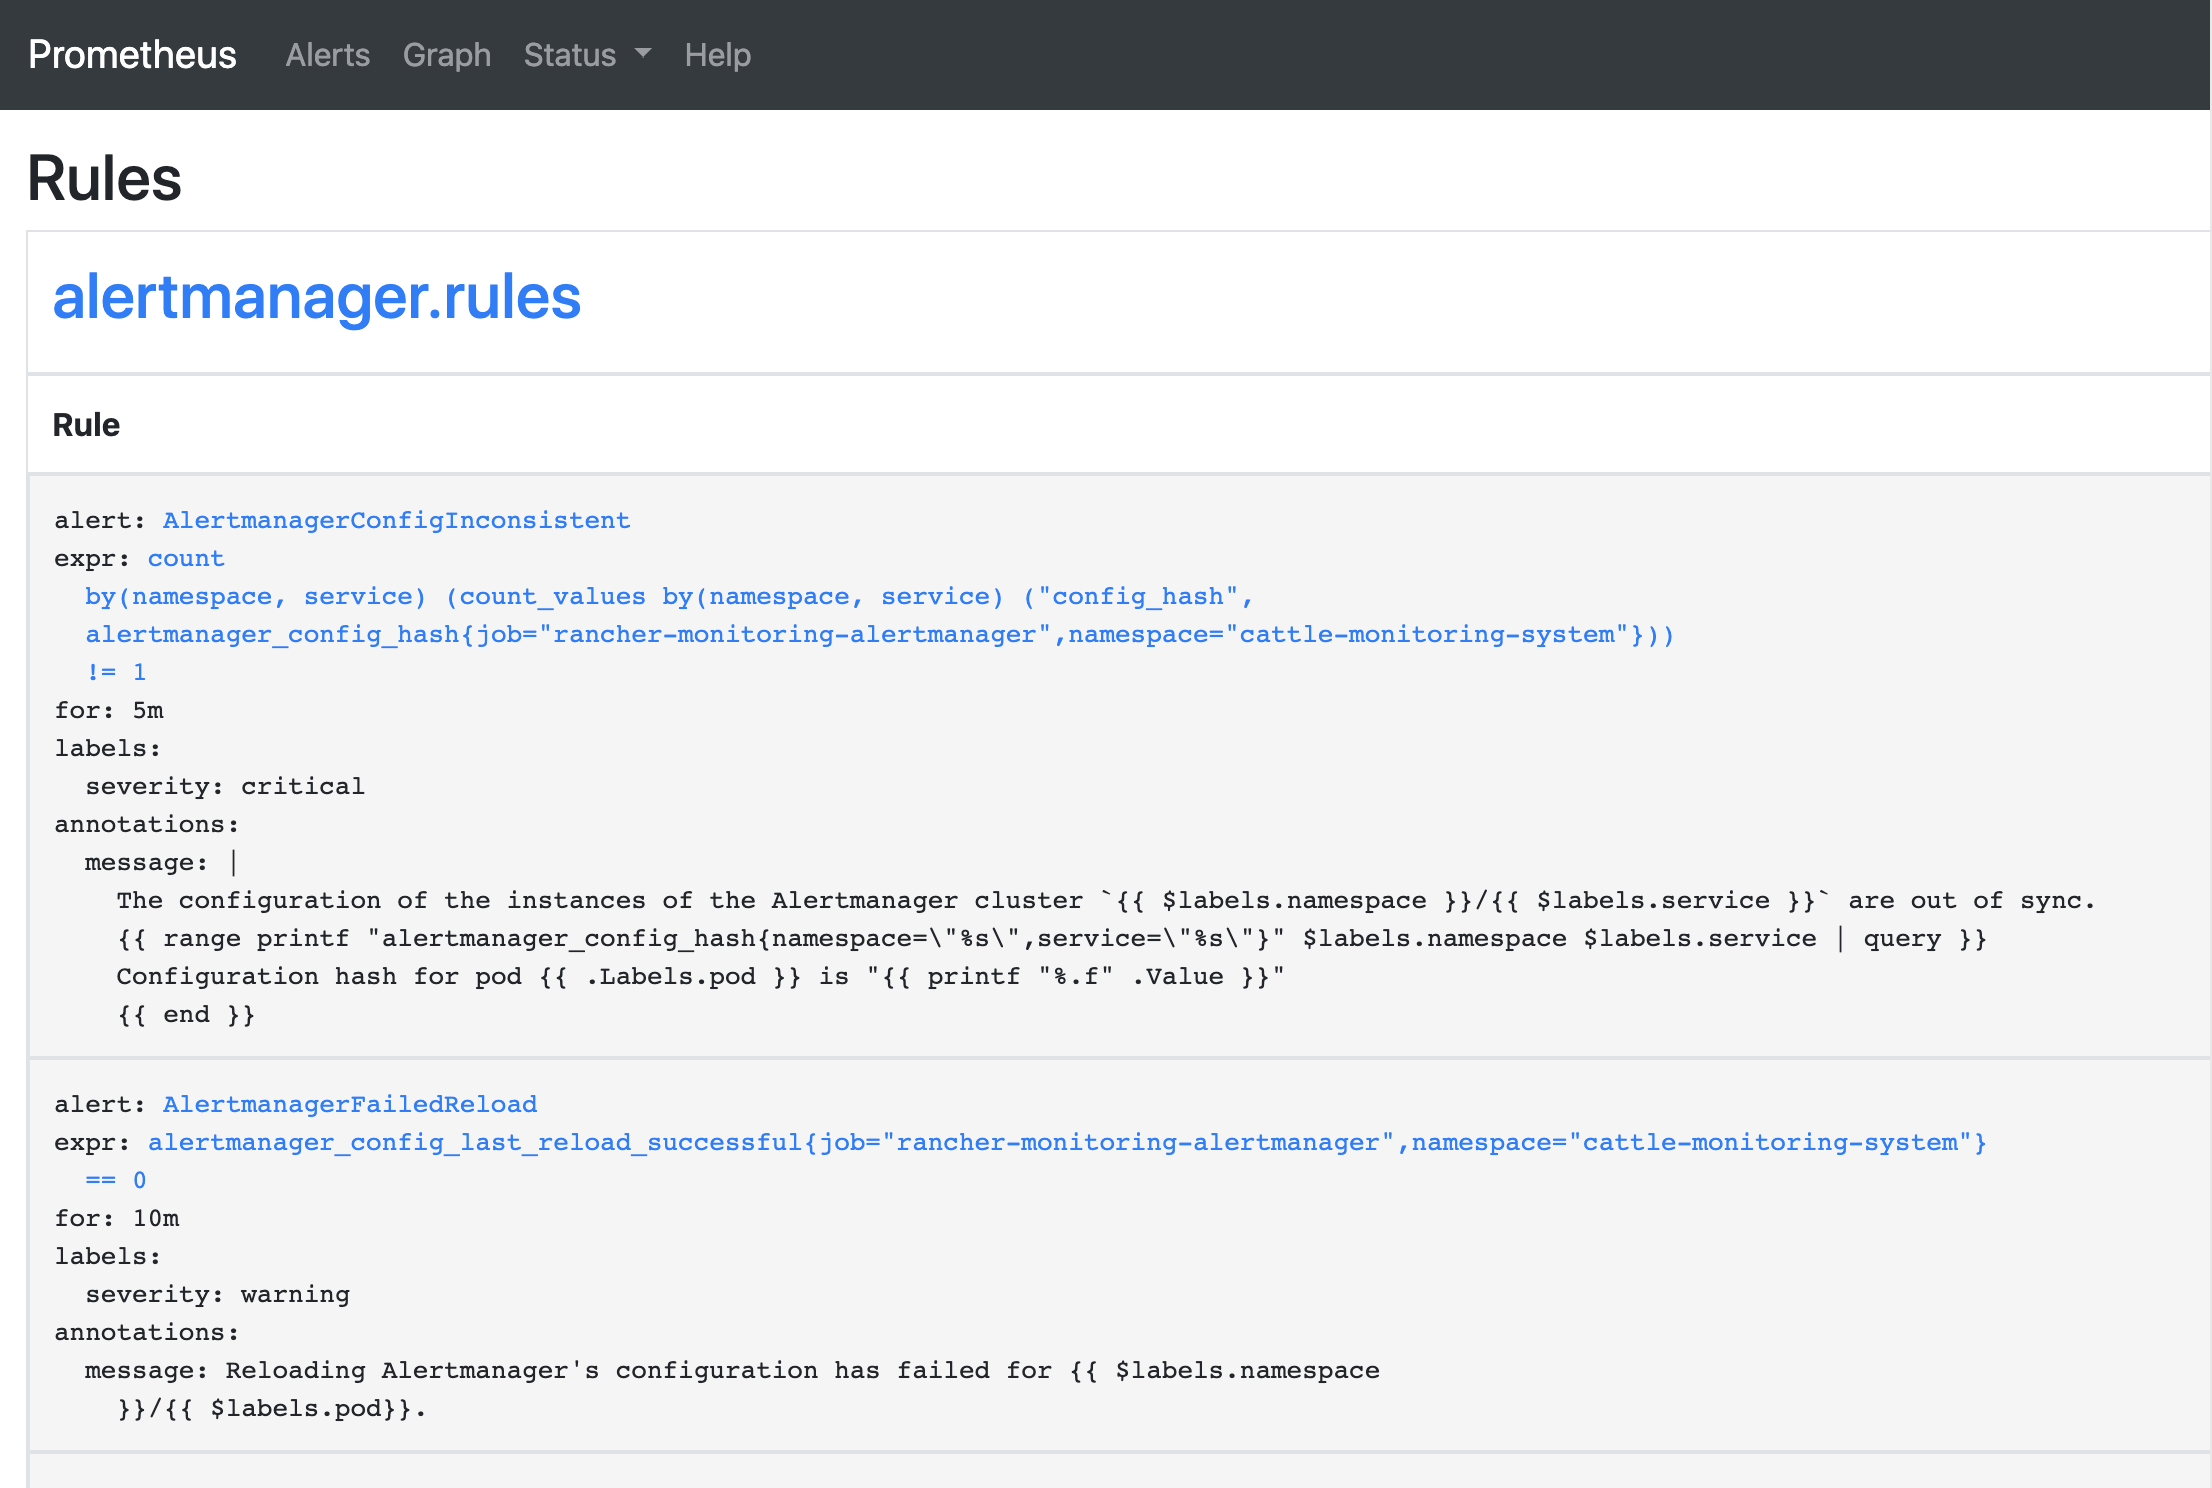
When you define a Rule (which is declared within a RuleGroup in a PrometheusRule resource), the spec of the Rule itself contains labels that are used by Alertmanager to figure out which Route should receive a certain Alert.
To see the PrometheusRules, install rancher-monitoring. Then:
- In the upper left corner, click ☰ > Cluster Management.
- On the Clusters page, go to the cluster where you want to see the visualizations and click Explore.
- In the left navigation bar, click Monitoring.
- Click Prometheus Rules.
You can also see the rules in the Prometheus UI:

For more information on configuring PrometheusRules in Rancher, see this page.
Legacy UI
For information on the dashboards available in v2.2 to v2.4 of Rancher, before the introduction of the rancher-monitoring application, see the Rancher v2.0—v2.4 docs.