Splunk
If your organization uses Splunk, you can configure Rancher to send it Kubernetes logs. Afterwards, you can log into your Splunk server to view logs.
Prerequisites:
- Configure HTTP event collection for your Splunk Server (Splunk Enterprise or Splunk Cloud).
- Either create a new token or copy an existing token.
For more information, see Splunk Documentation.
Splunk Configuration
In the Endpoint field, enter the IP address and port for you Splunk instance (i.e.
http://splunk-server:8088)- Splunk usually uses port
8088. If you're using Splunk Cloud, you'll need to work with Splunk support to get an endpoint URL.
- Splunk usually uses port
Enter the Token you obtained while completing the prerequisites (i.e., when you created a token in Splunk).
In the Source field, enter the name of the token as entered in Splunk.
Optional: Provide one or more index that's allowed for your token.
SSL Configuration
If your instance of Splunk uses SSL, your Endpoint will need to begin with https://. With the correct endpoint, the SSL Configuration form is enabled and ready to be completed.
Provide the Client Private Key and Client Certificate. You can either copy and paste them or upload them by using the Read from a file button.
You can use either a self-signed certificate or one provided by a certificate authority.
You can generate a self-signed certificate using an openssl command. For example:
openssl req -x509 -newkey rsa:2048 -keyout myservice.key -out myservice.cert -days 365 -nodes -subj "/CN=myservice.example.com"
Enter your Client Key Password.
Select whether or not you want to verify your SSL.
- If you are using a self-signed certificate, select Enabled - Input trusted server certificate, provide the CA Certificate PEM. You can copy and paste the certificate or upload it using the Read from a file button.
- If you are using a certificate from a certificate authority, select Enabled - Input trusted server certificate. You do not need to provide a CA Certificate PEM.
Viewing Logs
Log into your Splunk server.
Click on Search & Reporting. The number of Indexed Events listed should be increasing.
Click on Data Summary and select the Sources tab.

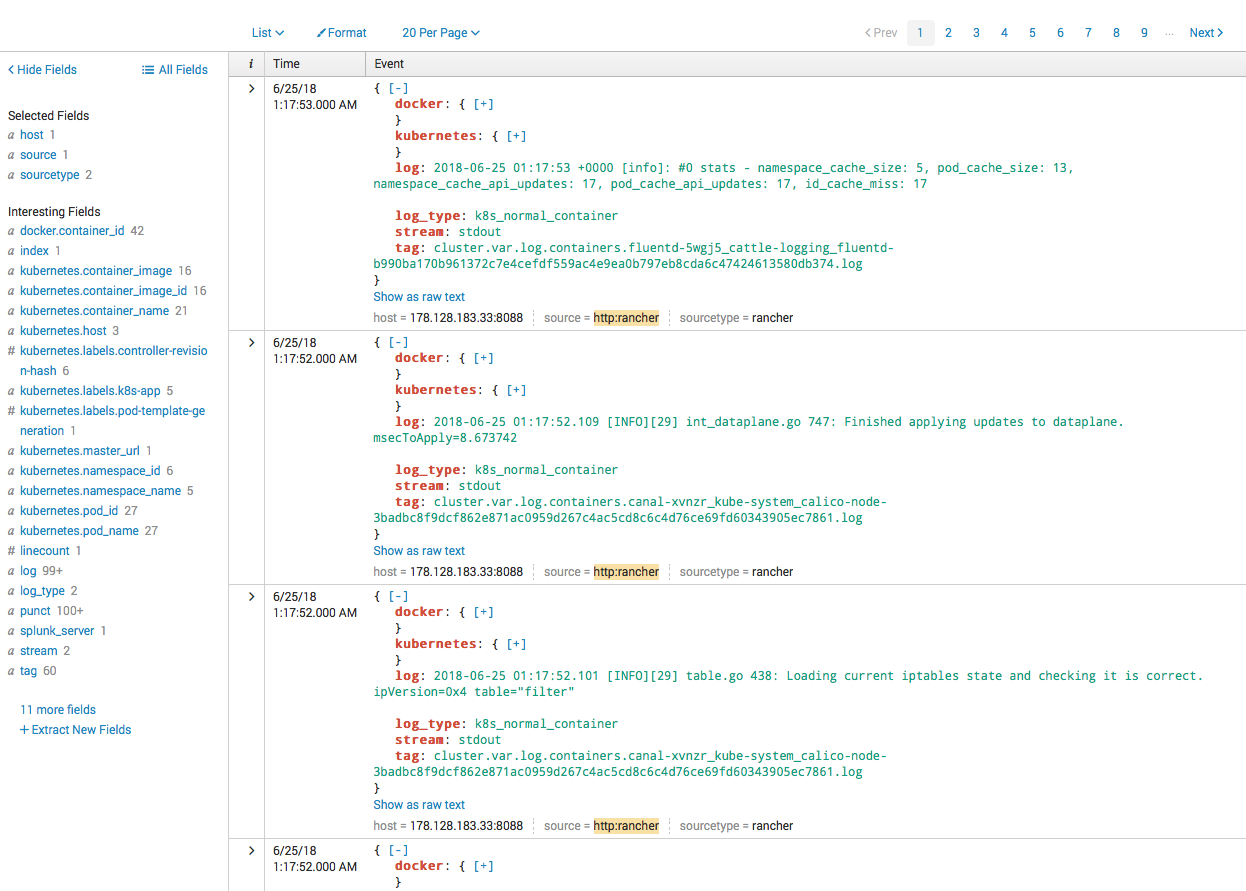
To view the actual logs, click on the source that you declared earlier.

Troubleshooting
You can use curl to see if HEC is listening for HTTP event data.
$ curl http://splunk-server:8088/services/collector/event \
    -H 'Authorization: Splunk 8da70994-b1b0-4a79-b154-bfaae8f93432' \
    -d '{"event": "hello world"}'
If Splunk is configured correctly, you should receive json data returning success code 0. You should be able
to send logging data to HEC.
If you received an error, check your configuration in Splunk and Rancher.