Role-based Access Control
This section describes the expectations for RBAC for Rancher Monitoring.
Cluster Admins
By default, only those with the cluster-admin ClusterRole should be able to:
- Install the
rancher-monitoringApp onto a cluster and all other relevant configuration performed on the chart deploy- e.g. whether default dashboards are created, what exporters are deployed onto the cluster to collect metrics, etc.
- Create / modify / delete Prometheus deployments in the cluster via Prometheus CRs
- Create / modify / delete Alertmanager deployments in the cluster via Alertmanager CRs
- Persist new Grafana dashboards or datasources via creating ConfigMaps in the appropriate namespace
- Expose certain Prometheus metrics to the k8s Custom Metrics API for HPA via a Secret in the
cattle-monitoring-systemnamespace
Users with Kubernetes ClusterRole-based Permissions
The rancher-monitoring chart installs the following three ClusterRoles. By default, they aggregate into the corresponding k8s ClusterRoles:
| ClusterRole | Aggregates To Default K8s ClusterRole |
|---|---|
monitoring-admin | admin |
monitoring-edit | edit |
monitoring-view | view |
These ClusterRoles provide different levels of access to the Monitoring CRDs based on the actions that can be performed:
| CRDs (monitoring.coreos.com) | Admin | Edit | View |
|---|---|---|---|
| Get, List, Watch | Get, List, Watch | Get, List, Watch |
| * | * | Get, List, Watch |
On a high level, the following permissions are assigned by default as a result.
Users with Kubernetes Admin/Edit Permissions
Only those with the the cluster-admin, admin or edit ClusterRole should be able to:
- Modify the scrape configuration of Prometheus deployments via ServiceMonitor and PodMonitor CRs
- Modify the alerting / recording rules of a Prometheus deployment via PrometheusRules CRs
Users with Kubernetes View Permissions
Only those with who have some Kubernetes ClusterRole should be able to:
- View the configuration of Prometheuses that are deployed within the cluster
- View the configuration of Alertmanagers that are deployed within the cluster
- View the scrape configuration of Prometheus deployments via ServiceMonitor and PodMonitor CRs
- View the alerting/recording rules of a Prometheus deployment via PrometheusRules CRs
Additional Monitoring Roles
Monitoring also creates additional Roles that are not assigned to users by default but are created within the cluster. They can be bound to a namespace by deploying a RoleBinding that references it. To define a RoleBinding with kubectl instead of through Rancher, click here.
Admins should use these roles to provide more fine-grained access to users:
| Role | Purpose |
|---|---|
| monitoring-config-admin | Allow admins to assign roles to users to be able to view / modify Secrets and ConfigMaps within the cattle-monitoring-system namespace. Modifying Secrets / ConfigMaps in this namespace could allow users to alter the cluster's Alertmanager configuration, Prometheus Adapter configuration, additional Grafana datasources, TLS secrets, etc. |
| monitoring-config-edit | Allow admins to assign roles to users to be able to view / modify Secrets and ConfigMaps within the cattle-monitoring-system namespace. Modifying Secrets / ConfigMaps in this namespace could allow users to alter the cluster's Alertmanager configuration, Prometheus Adapter configuration, additional Grafana datasources, TLS secrets, etc. |
| monitoring-config-view | Allow admins to assign roles to users to be able to view Secrets and ConfigMaps within the cattle-monitoring-system namespace. Viewing Secrets / ConfigMaps in this namespace could allow users to observe the cluster's Alertmanager configuration, Prometheus Adapter configuration, additional Grafana datasources, TLS secrets, etc. |
| monitoring-dashboard-admin | Allow admins to assign roles to users to be able to edit / view ConfigMaps within the cattle-dashboards namespace. ConfigMaps in this namespace will correspond to Grafana Dashboards that are persisted onto the cluster. |
| monitoring-dashboard-edit | Allow admins to assign roles to users to be able to edit / view ConfigMaps within the cattle-dashboards namespace. ConfigMaps in this namespace will correspond to Grafana Dashboards that are persisted onto the cluster. |
| monitoring-dashboard-view | Allow admins to assign roles to users to be able to view ConfigMaps within the cattle-dashboards namespace. ConfigMaps in this namespace will correspond to Grafana Dashboards that are persisted onto the cluster. |
Additional Monitoring ClusterRoles
Monitoring also creates additional ClusterRoles that are not assigned to users by default but are created within the cluster. They are not aggregated by default but can be bound to a namespace by deploying a RoleBinding or ClusterRoleBinding that references it. To define a RoleBinding with kubectl instead of through Rancher, click here.
| Role | Purpose |
|---|---|
| monitoring-ui-view | Available as of Monitoring v2 14.5.100+ Provides read-only access to external Monitoring UIs by giving a user permission to list the Prometheus, Alertmanager, and Grafana endpoints and make GET requests to Prometheus, Grafana, and Alertmanager UIs through the Rancher proxy. |
Assigning Roles and ClusterRoles with kubectl
An alternative method to using Rancher to attach a Role or ClusterRole to a user or group is by defining bindings in YAML files that you create. You must first configure the RoleBinding with the YAML file, then you apply the config changes by running the kubectl apply command.
- Roles: Below is an example of a YAML file to help you configure
RoleBindingsin Kubernetes to attach to a user. You will need to fill in the name below, and name is case-sensitive.
# monitoring-config-view-role-binding.yaml
apiVersion: rbac.authorization.k8s.io/v1
kind: RoleBinding
metadata:
  name: monitoring-config-view
  namespace: cattle-monitoring-system
roleRef:
  kind: Role
  name: monitoring-config-view
  apiGroup: rbac.authorization.k8s.io
subjects:
- kind: User
  name: u-b4qkhsnliz # this can be found via `kubectl get users -A`
  apiGroup: rbac.authorization.k8s.io
kubectl: Below is an example of a
kubectlcommand used to apply the binding you've created in the YAML file. As noted, you will need to fill in your YAML filename accordingly.- **
kubectl apply -f monitoring-config-view-role-binding.yaml
- **
Users with Rancher Cluster Manager Based Permissions
The relationship between the default roles deployed by Rancher Cluster Manager (i.e. cluster-owner, cluster-member, project-owner, project-member), the default k8s roles, and the roles deployed by the rancher-monitoring chart are detailed in the table below:
| Cluster Manager Role | k8s Role | Monitoring ClusterRole / Role | ClusterRoleBinding or RoleBinding? |
|---|---|---|---|
| cluster-owner | cluster-admin | N/A | ClusterRoleBinding |
| cluster-member | admin | monitoring-admin | ClusterRoleBinding |
| project-owner | admin | monitoring-admin | RoleBinding within Project namespace |
| project-member | edit | monitoring-edit | RoleBinding within Project namespace |
In addition to these default Roles, the following additional Rancher project roles can be applied to members of your Cluster to provide additional access to Monitoring. These Rancher Roles will be tied to ClusterRoles deployed by the Monitoring chart:
| Cluster Manager Role | Kubernetes ClusterRole | Available In Rancher From | Available in Monitoring v2 From |
|---|---|---|---|
| View Monitoring* | monitoring-ui-view | 2.4.8+ | 9.4.204+ |
* A User bound to the View Monitoring Rancher Role only has permissions to access external Monitoring UIs if provided links to those UIs. In order to access the Monitoring Pane on Cluster Explorer to get those links, the User must be a Project Member of at least one Project.
Differences in 2.5.x
Users with the project-member or project-owners roles assigned will not be given access to either Prometheus or Grafana in Rancher 2.5.x since we only create Grafana or Prometheus on a cluster-level.
In addition, while project owners will still be only able to add ServiceMonitors / PodMonitors that scrape resources within their project's namespace by default, PrometheusRules are not scoped to a single namespace / project. Therefore, any alert rules or recording rules created by project-owners within their project namespace will be applied across the entire cluster, although they will be unable to view / edit / delete any rules that were created outside the project's namespace.
Assigning Additional Access
If cluster-admins would like to provide additional admin/edit access to users outside of the roles offered by the rancher-monitoring chart, the following table identifies the potential impact:
| CRDs (monitoring.coreos.com) | Can it cause impact outside of a namespace / project? | Impact |
|---|---|---|
prometheuses | Yes, this resource can scrape metrics from any targets across the entire cluster (unless the Operator itself is otherwise configured). | User will be able to define the configuration of new cluster-level Prometheus deployments that should be created in the cluster. |
alertmanagers | No | User will be able to define the configuration of new cluster-level Alertmanager deployments that should be created in the cluster. Note: if you just want to allow users to configure settings like Routes and Receivers, you should just provide access to the Alertmanager Config Secret instead. |
| No, not by default; this is configurable via ignoreNamespaceSelectors on the Prometheus CR. | User will be able to set up scrapes by Prometheus on endpoints exposed by Services / Pods within the namespace they are given this permission in. |
prometheusrules | Yes, PrometheusRules are cluster-scoped. | User will be able to define alert or recording rules on Prometheus based on any series collected across the entire cluster. |
| k8s Resources | Namespace | Can it cause impact outside of a namespace / project? | Impact |
|---|---|---|---|
| cattle-monitoring-system | Yes, Configs and Secrets in this namespace can impact the entire monitoring / alerting pipeline. | User will be able to create or edit Secrets / ConfigMaps such as the Alertmanager Config, Prometheus Adapter Config, TLS secrets, additional Grafana datasources, etc. This can have broad impact on all cluster monitoring / alerting. |
| cattle-dashboards | Yes, Configs and Secrets in this namespace can create dashboards that make queries on all metrics collected at a cluster-level. | User will be able to create Secrets / ConfigMaps that persist new Grafana Dashboards only. |
Role-based Access Control for Grafana
Rancher allows any users who are authenticated by Kubernetes and have access the Grafana service deployed by the Rancher Monitoring chart to access Grafana via the Rancher Dashboard UI. By default, all users who are able to access Grafana are given the Viewer role, which allows them to view any of the default dashboards deployed by Rancher.
However, users can choose to log in to Grafana as an Admin if necessary. The default Admin username and password for the Grafana instance will be admin/prom-operator, but alternative credentials can also be supplied on deploying or upgrading the chart.
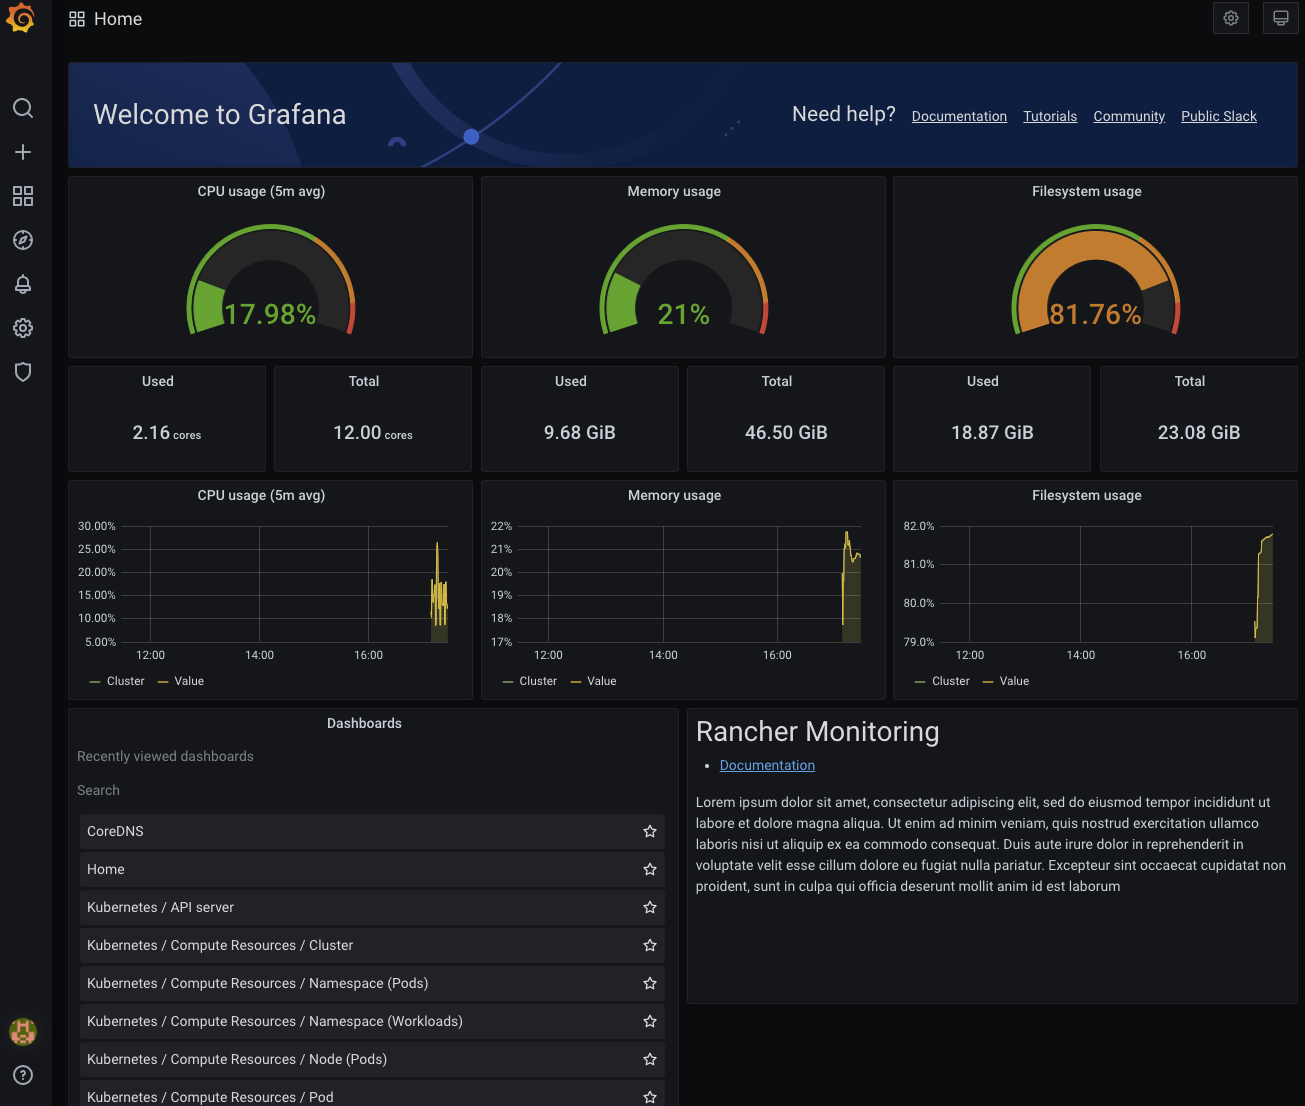
To see the Grafana UI, install rancher-monitoring. Then go to the Cluster Explorer. In the top left corner, click Cluster Explorer > Monitoring. Then click **Grafana.

