Enable Prometheus Federator
Requirements
By default, Prometheus Federator is configured and intended to be deployed alongside rancher-monitoring, which deploys Prometheus Operator alongside a Cluster Prometheus that each Project Monitoring Stack is configured to federate namespace-scoped metrics from by default.
For instructions on installing rancher-monitoring, refer to this page.
The default configuration should already be compatible with your rancher-monitoring stack. However, to optimize the security and usability of Prometheus Federator in your cluster, we recommend making these additional configurations to rancher-monitoring:
- Ensure the cattle-monitoring-system namespace is placed into the System Project.
- Configure rancher-monitoring to only watch for resources created by the Helm chart itself.
- Increase the CPU / memory limits of the Cluster Prometheus.
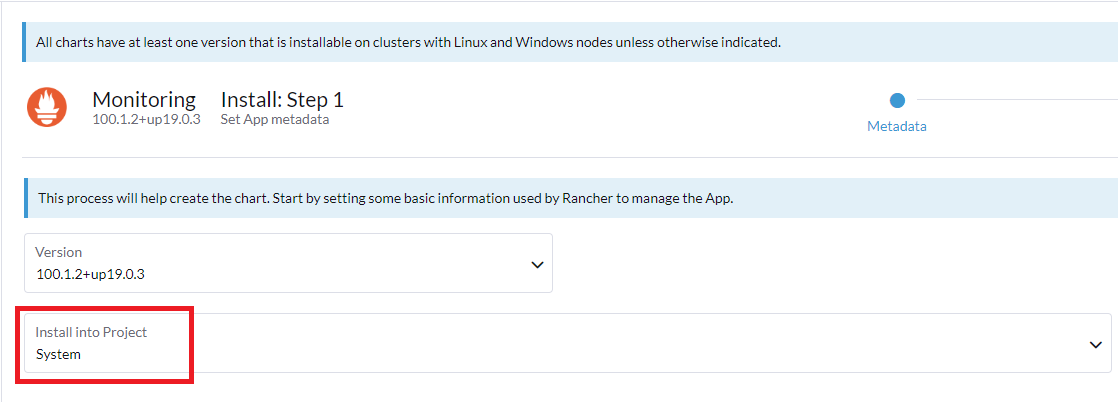
Ensure the cattle-monitoring-system namespace is placed into the System Project (or a similarly locked down Project that has access to other Projects in the cluster)

Prometheus Operator's security model expects that the namespace it is deployed into (e.g., cattle-monitoring-system) has limited access for anyone except Cluster Admins to avoid privilege escalation via execing into Pods (such as the Jobs executing Helm operations). In addition, deploying Prometheus Federator and all Project Prometheus stacks into the System Project ensures that each Project Prometheus is able to reach out to scrape workloads across all Projects, even if Network Policies are defined via Project Network Isolation. It also provides limited access for Project Owners, Project Members, and other users so that they're unable to access data that they shouldn't have access to (i.e., being allowed to exec into pods, set up the ability to scrape namespaces outside of a given Project, etc.).
Open the
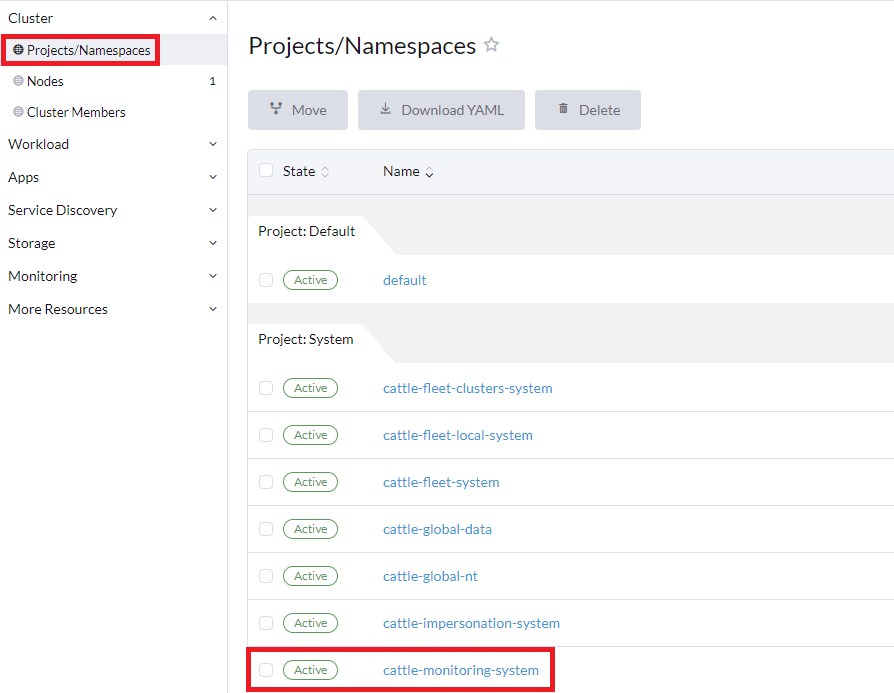
Systemproject to check your namespaces:Click Cluster > Projects/Namespaces in the Rancher UI. This will display all of the namespaces in the
Systemproject:
If you have an existing Monitoring V2 installation within the
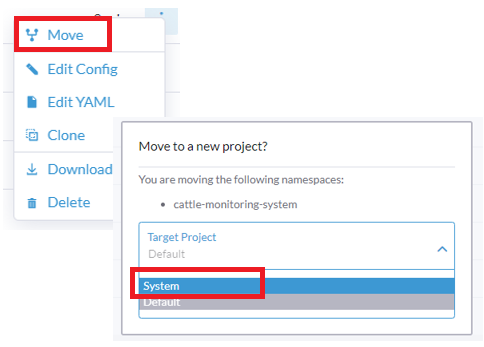
cattle-monitoring-systemnamespace, but that namespace is not in theSystemproject, you may move thecattle-monitoring-systemnamespace into theSystemproject or into another project of limited access. To do so, you may either:Drag and drop the namespace into the
Systemproject orSelect ⋮ to the right of the namespace, click Move, then choose
Systemfrom the Target Project dropdown
Configure rancher-monitoring to only watch for resources created by the Helm chart itself
Since each Project Monitoring Stack will watch the other namespaces and collect additional custom workload metrics or dashboards already, it's recommended to configure the following settings on all selectors to ensure that the Cluster Prometheus Stack only monitors resources created by the Helm Chart itself:
matchLabels:
  release: "rancher-monitoring"
The following selector fields are recommended to have this value:
.Values.alertmanager.alertmanagerSpec.alertmanagerConfigSelector.Values.prometheus.prometheusSpec.serviceMonitorSelector.Values.prometheus.prometheusSpec.podMonitorSelector.Values.prometheus.prometheusSpec.ruleSelector.Values.prometheus.prometheusSpec.probeSelector
Once this setting is turned on, you can always create ServiceMonitors or PodMonitors that are picked up by the Cluster Prometheus by adding the label release: "rancher-monitoring" to them, in which case they will be ignored by Project Monitoring Stacks automatically by default, even if the namespace in which those ServiceMonitors or PodMonitors reside in are not system namespaces.
If you don't want to allow users to be able to create ServiceMonitors and PodMonitors that aggregate into the Cluster Prometheus in Project namespaces, you can additionally set the namespaceSelectors on the chart to only target system namespaces (which must contain cattle-monitoring-system and cattle-dashboards, where resources are deployed into by default by rancher-monitoring; you will also need to monitor the default namespace to get apiserver metrics or create a custom ServiceMonitor to scrape apiserver metrics from the Service residing in the default namespace) to limit your Cluster Prometheus from picking up other Prometheus Operator CRs. In that case, it would be recommended to turn .Values.prometheus.prometheusSpec.ignoreNamespaceSelectors=true to allow you to define ServiceMonitors that can monitor non-system namespaces from within a system namespace.
Increase the CPU / memory limits of the Cluster Prometheus
Depending on a cluster's setup, it's generally recommended to give a large amount of dedicated memory to the Cluster Prometheus to avoid restarts due to out-of-memory errors (OOMKilled) usually caused by churn created in the cluster that causes a large number of high cardinality metrics to be generated and ingested by Prometheus within one block of time. This is one of the reasons why the default Rancher Monitoring stack expects around 4GB of RAM to be able to operate in a normal-sized cluster. However, when introducing Project Monitoring Stacks that are all sending /federate requests to the same Cluster Prometheus and are reliant on the Cluster Prometheus being "up" to federate that system data on their namespaces, it's even more important that the Cluster Prometheus has an ample amount of CPU / memory assigned to it to prevent an outage that can cause data gaps across all Project Prometheis in the cluster.
There are no specific recommendations on how much memory the Cluster Prometheus should be configured with since it depends entirely on the user's setup (namely the likelihood of encountering a high churn rate and the scale of metrics that could be generated at that time); it generally varies per setup.
Install the Prometheus Federator Application
Click ☰ > Cluster Management.
Go to the cluster that you want to install Prometheus Federator and click Explore.
Click Apps -> Charts.
Click the Prometheus Federator chart.
Click Install.
On the Metadata page, click Next.
In the Namespaces > Project Release Namespace Project ID field, the
System Projectis used as the default but can be overridden with another project with similarly limited access. Project IDs can be found with the following command run in the local upstream cluster:kubectl get projects -A -o custom-columns="NAMESPACE":.metadata.namespace,"ID":.metadata.name,"NAME":.spec.displayNameClick Install.
Result: The Prometheus Federator app is deployed in the cattle-monitoring-system namespace.